
Noël Thomson is a global supply chain expert and Former NZTE Supply Chain Advisor. He is Co-founder of Synergic Technologies, a supply chain and technology consulting firm that provides supply chain technology solutions to ambitious New Zealand businesses. Noël has 30+ years’ experience in supply chains, manufacturing, and technology, and has helped many businesses implement supply chain planning, including Fonterra global operations.
Here, Noël shares his insights on how sales and operations planning will help you protect your business from risk and identify opportunities to increase your profits.
S&OP Planning and Processes
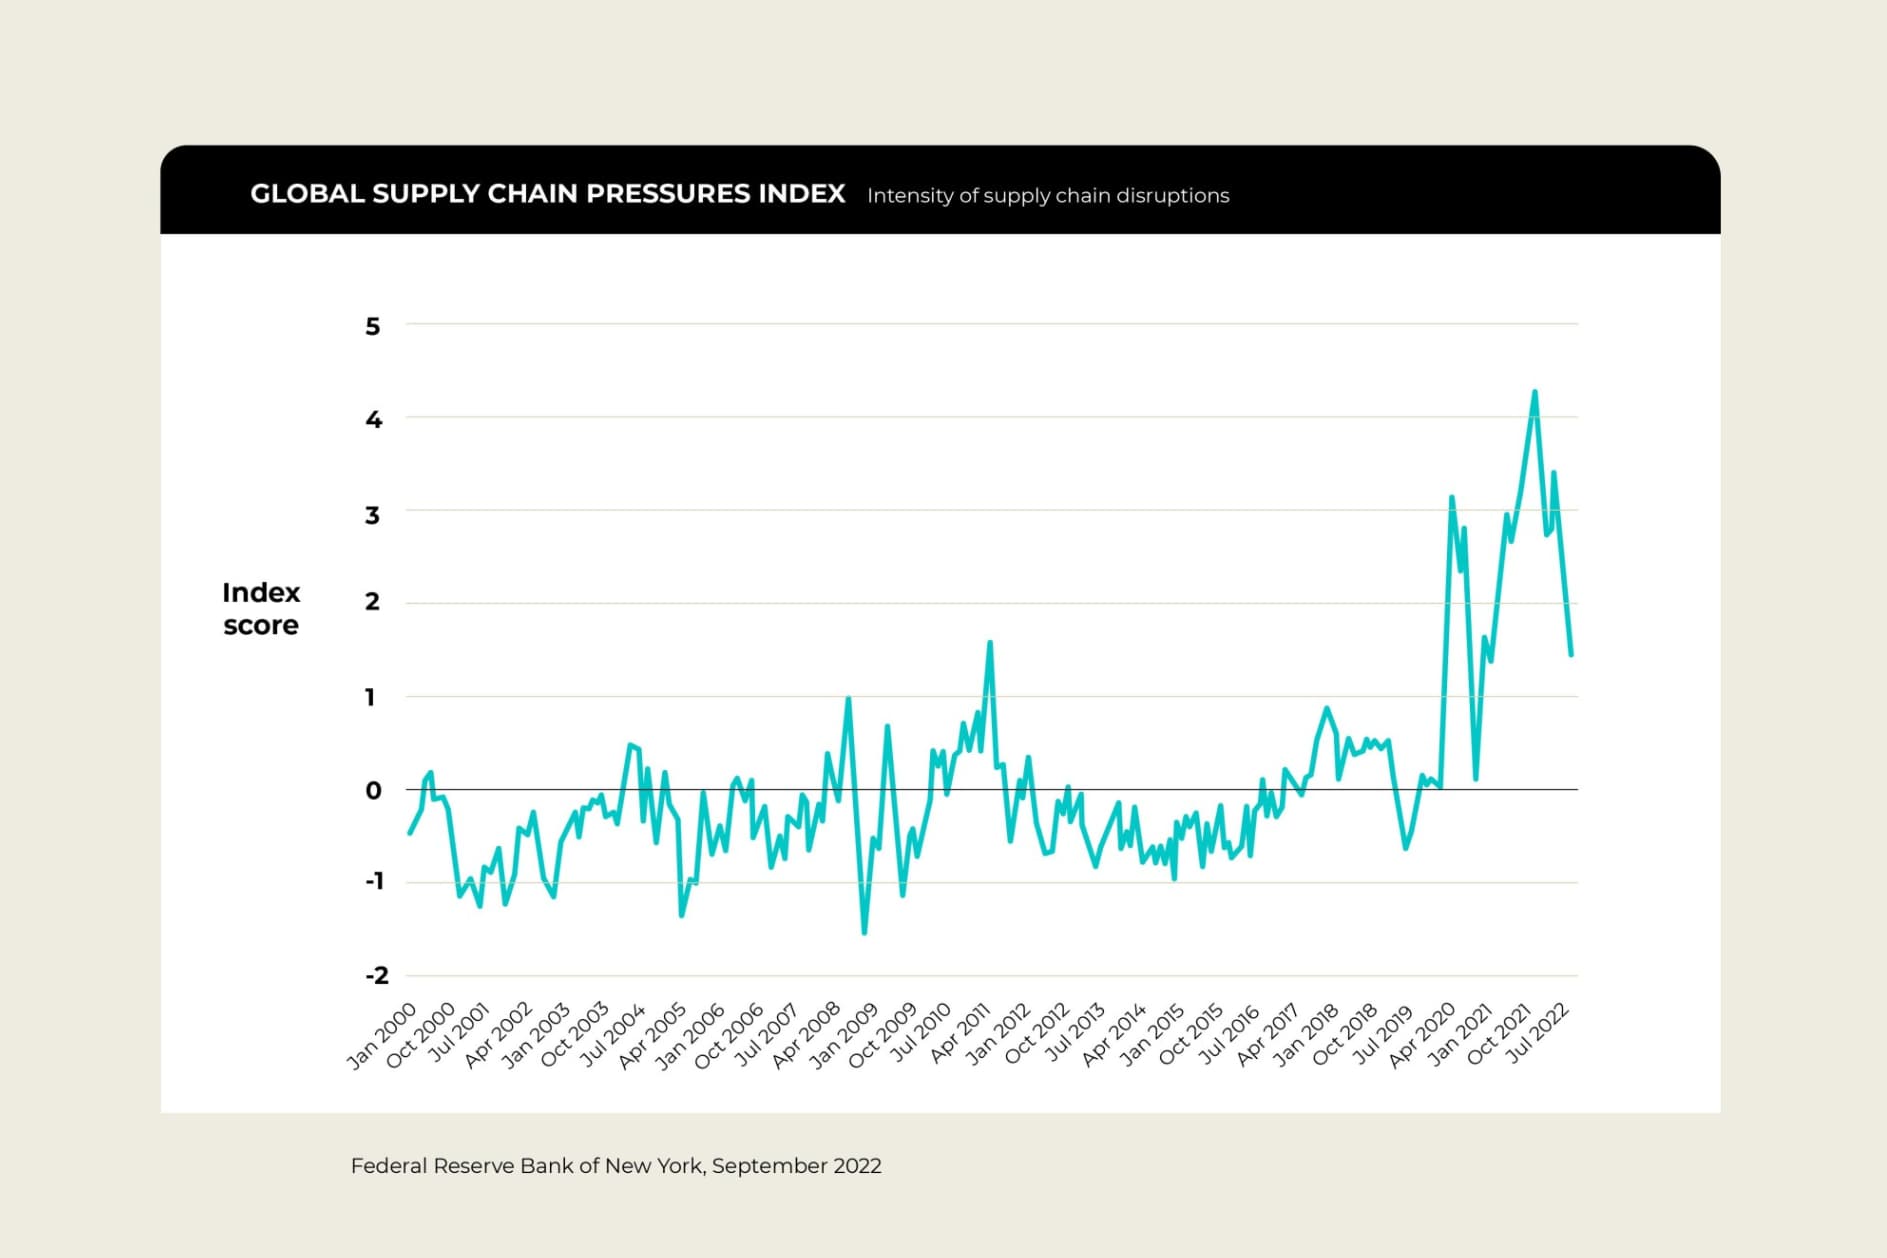
S&OP planning helps you cope with disruption. For around the last 20 years, things had been ticking along with relatively low major supply chain pressures. Because of the COVID-19 pandemic, supply chain disruptions escalated by 300–400% (Federal Reserve Bank of New York Global Supply Chain Pressure Index, September 2022). The pandemic changed the supply chain industry, particularly logistics.
International Data Corporation’s global data survey on supply chains revealed that:
Demand has become very unreliable
Suppliers have become less reliable, with cost increases from freight, inflationary pressures, and supply shortages
Factories have had to close due to COVID restrictions
Transport delays and cost increases in transport
You need to be able to look beyond your own business and plan for current and future disruptions.
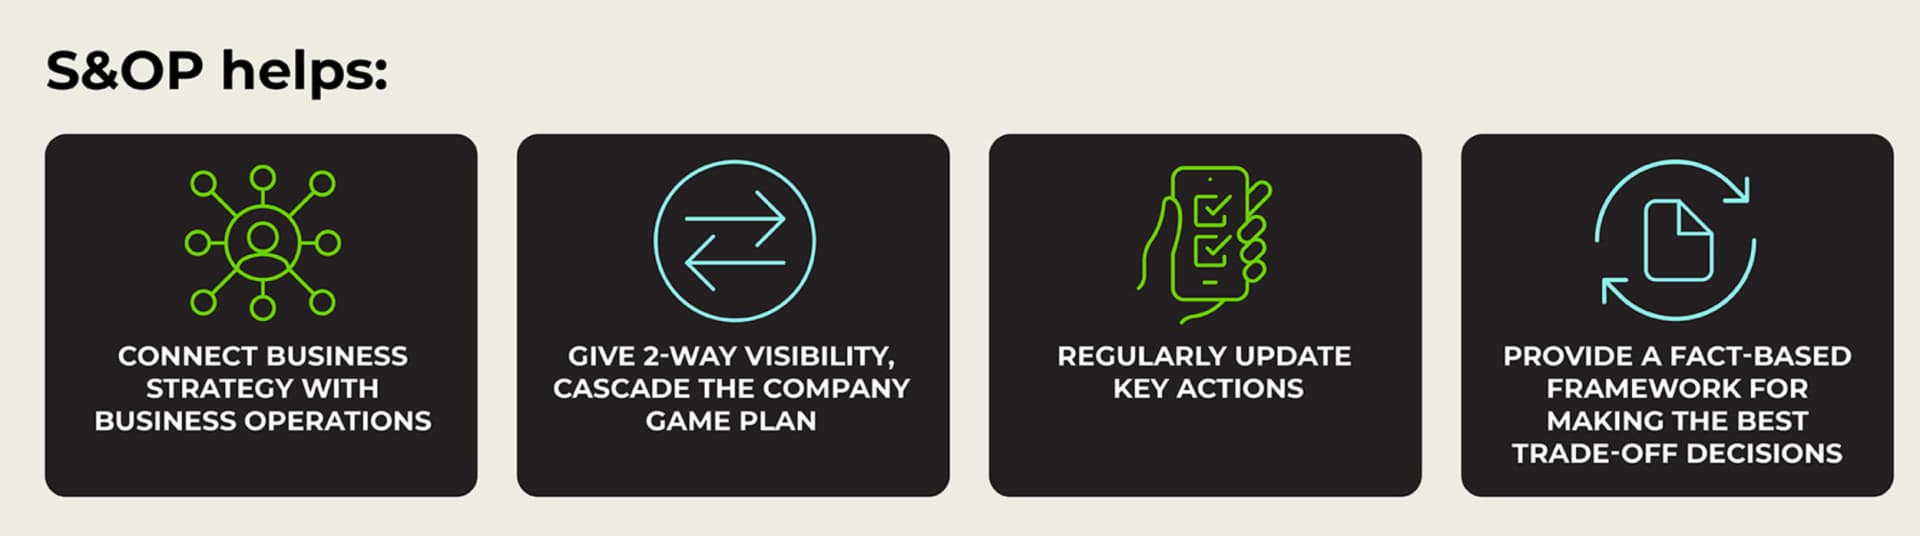
“The fundamental goal of S&OP planning is to grow your profits by driving volume through demand and supply plans.”
Supply Chain Resilience
Supply chain resilience involves three key factors:
Visibility
Having visibility across your entire supply chain
Intelligence
Understanding what it means, including the impacts
Agility
Reacting and changing your network and plans
You want to be able to collaborate with your customers, suppliers, manufacturers, third-party logistics, and more. Companies that achieve good S&OP processes have:
The Evidence: Aberdeen Group Research
Aberdeen Group researched S&OP effectiveness and found that businesses more mature in S&OP consistently outperform those that don’t do S&OP planning:
16%
Better service level
18%
Higher forecast accuracy
37%
Better cash-to-cash cycle
That 37% better cash-to-cash cycle is an important number, especially as businesses are investing more in inventory.
Case Study: NZ Sports Company
Noël Thomson worked with a New Zealand sports company that now has an efficient S&OP process in place. The company initially felt that the long lead time for manufacturing and to source materials was disappointing its customers.
After going through S&OP planning, management realised they actually had a capacity constraint in production. This was the result of a decision made when operations were set up, and it was holding the business back.
S&OP is all about planning, visibility, and looking forward. This business didn’t change its systems. It just implemented some smart insights from the operations manager and analysts in its sales team, and built some tools using Excel.
The company started assessing its unconstrained demand. For the first time, it looked at its potential sales and was shocked at how much it was being held back by capacity. Management decided to invest in capacity increase, grow the company’s offshore manufacturing plant, and S&OP process, and look at its unconstrained demand. This is what they now call demand sensing — having advance notice of what customers will buy and feeding that into their capacity plan.
34%
Reduction in lead time to customers
Unlocked Sales
Sales team able to go out and sell more products — rather than being held back
How to Do S&OP Planning
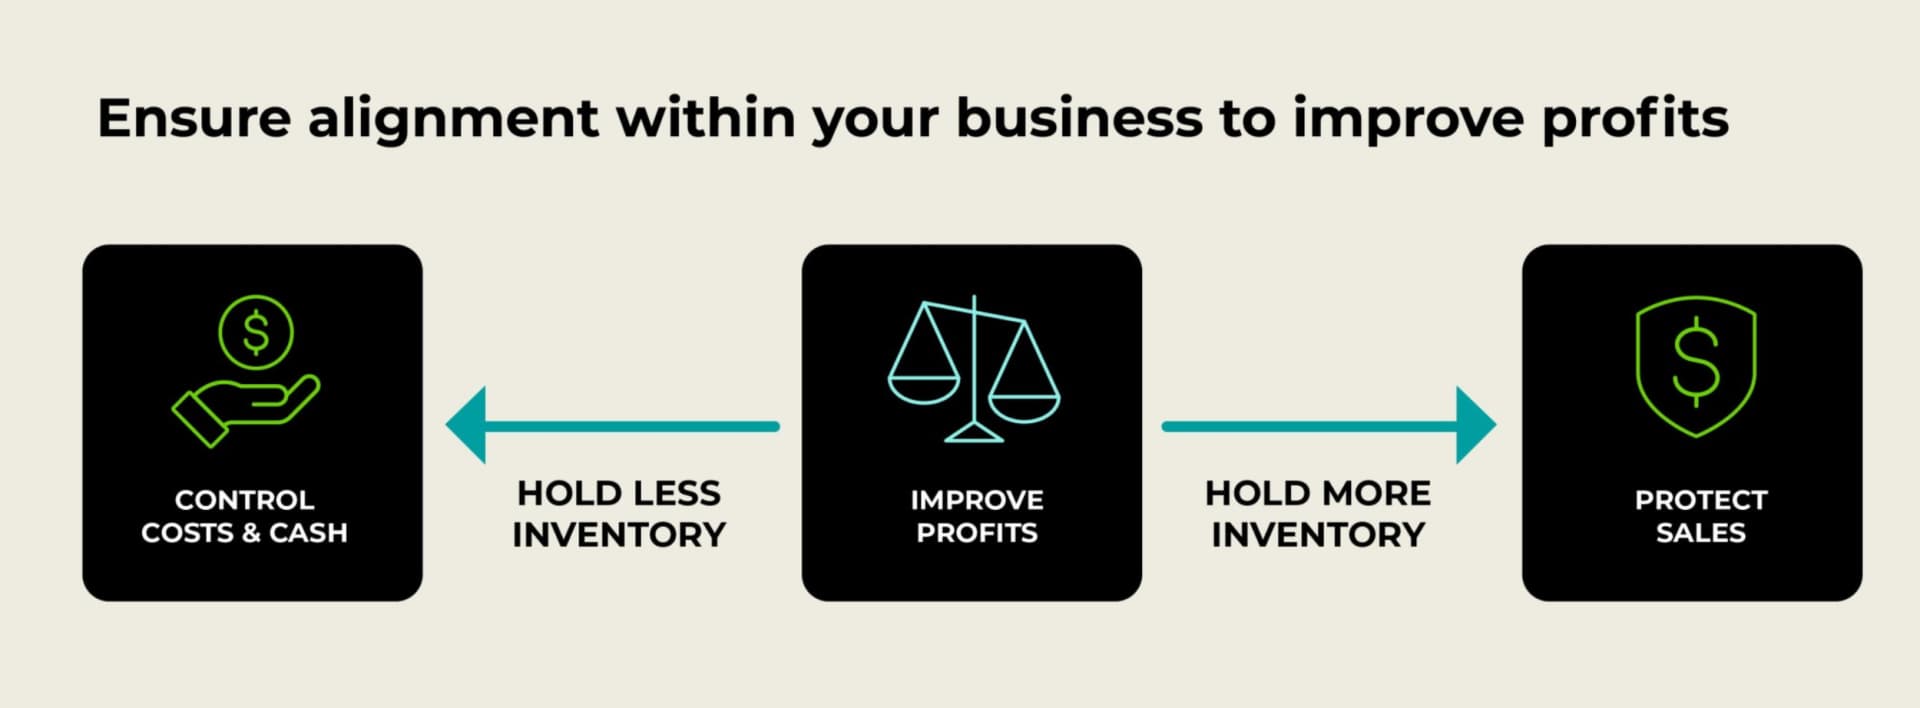
The goal of S&OP is to balance the demand for more inventory to generate sales, with less inventory to save costs and working capital. Balancing these creates improved profits. An imbalance will see your profits decline.
Good S&OP is achieved through the behaviour of your executive management and team leaders, and their familiarity with S&OP (sometimes called maturity). It’s also about time spent doing S&OP planning, using this framework and process.
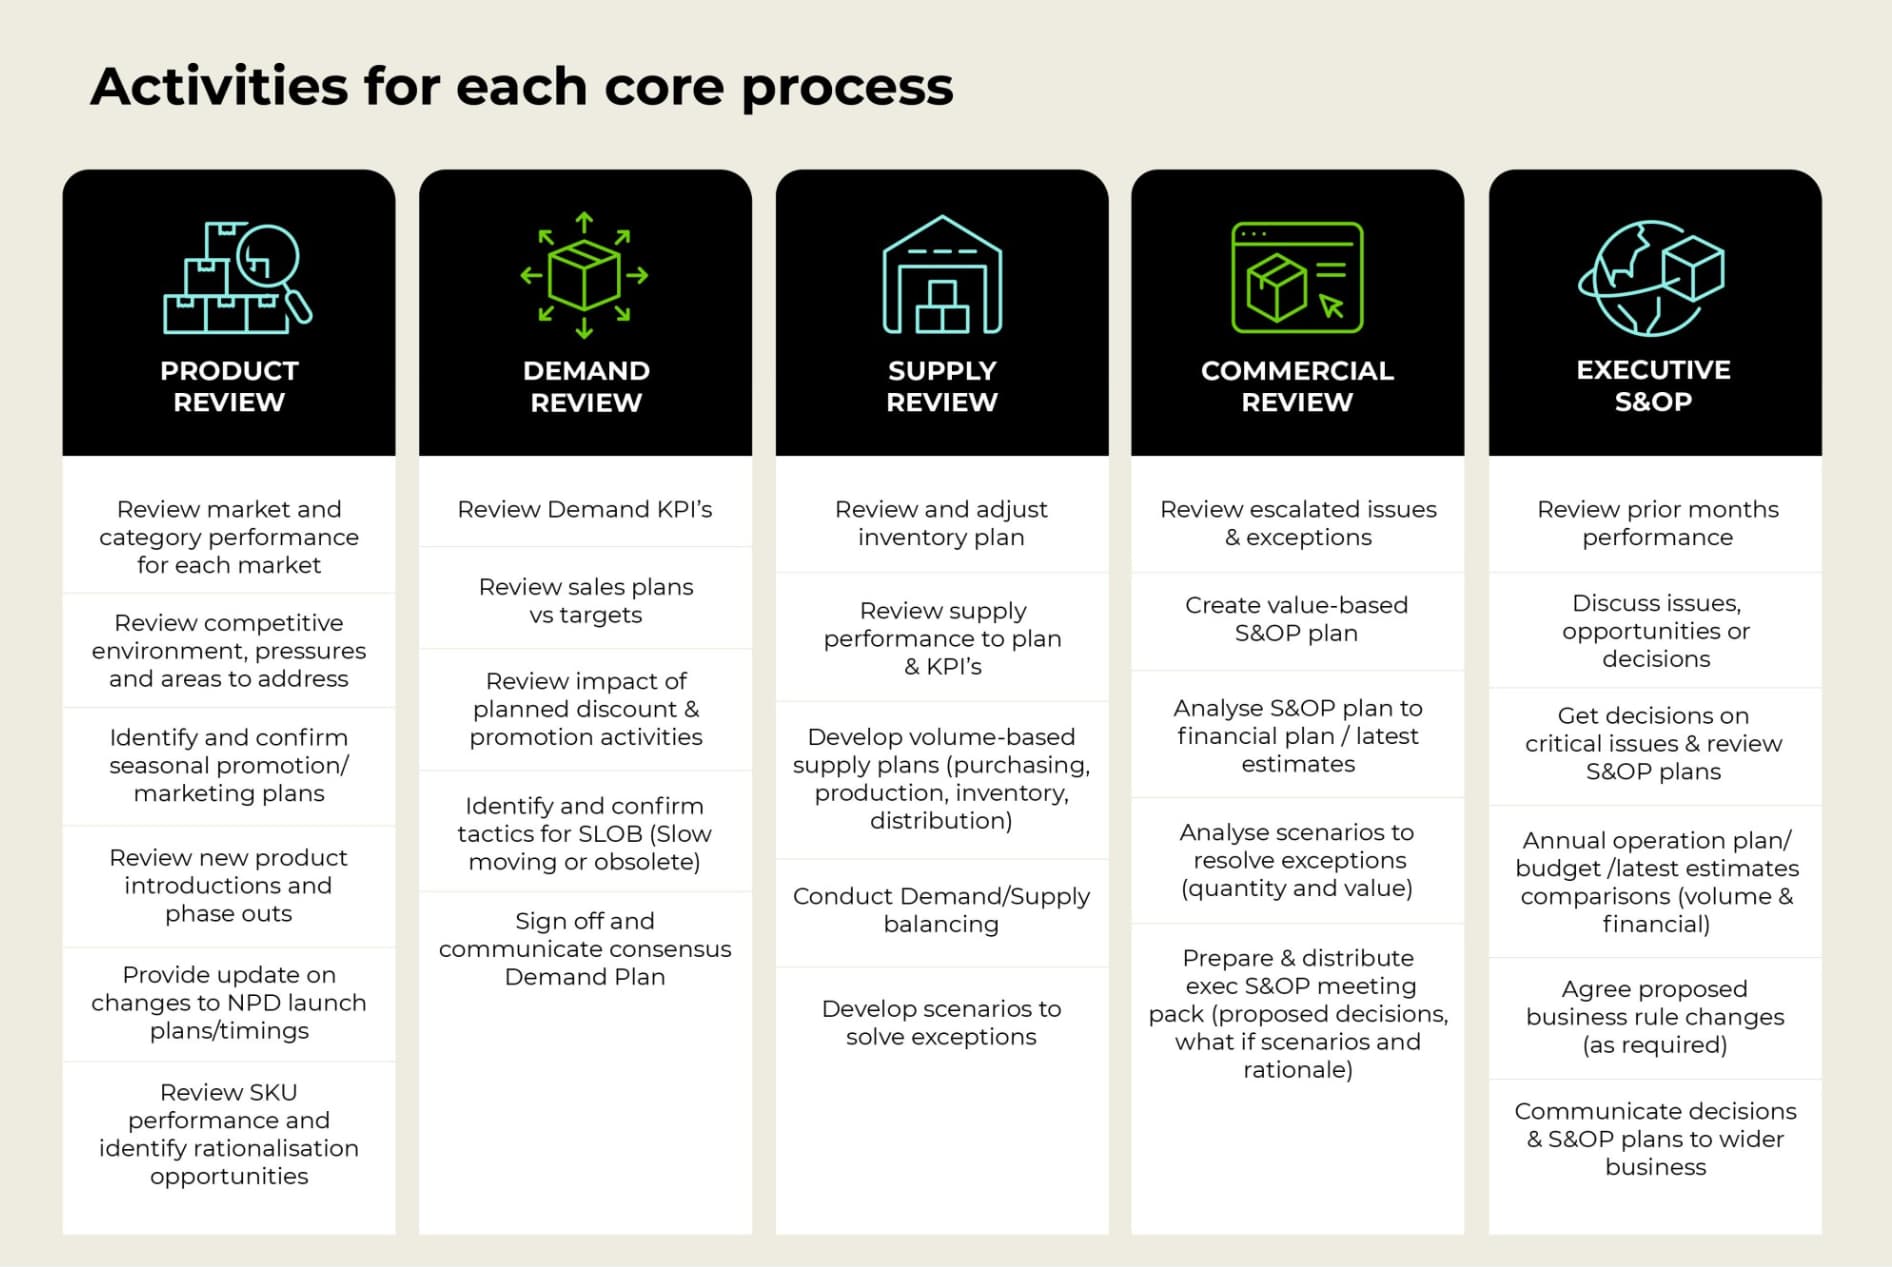
When you meet, you make decisions. With S&OP planning, there are four key meetings, plus a product review. Between the meetings are planning and activities to set and review sales targets, and the impact of your discounts and promotional activities. You’ll also identify and analyse slow-moving stock, and other things. At your S&OP meetings you agree, align, and get consensus on decisions in a cross-functional team.
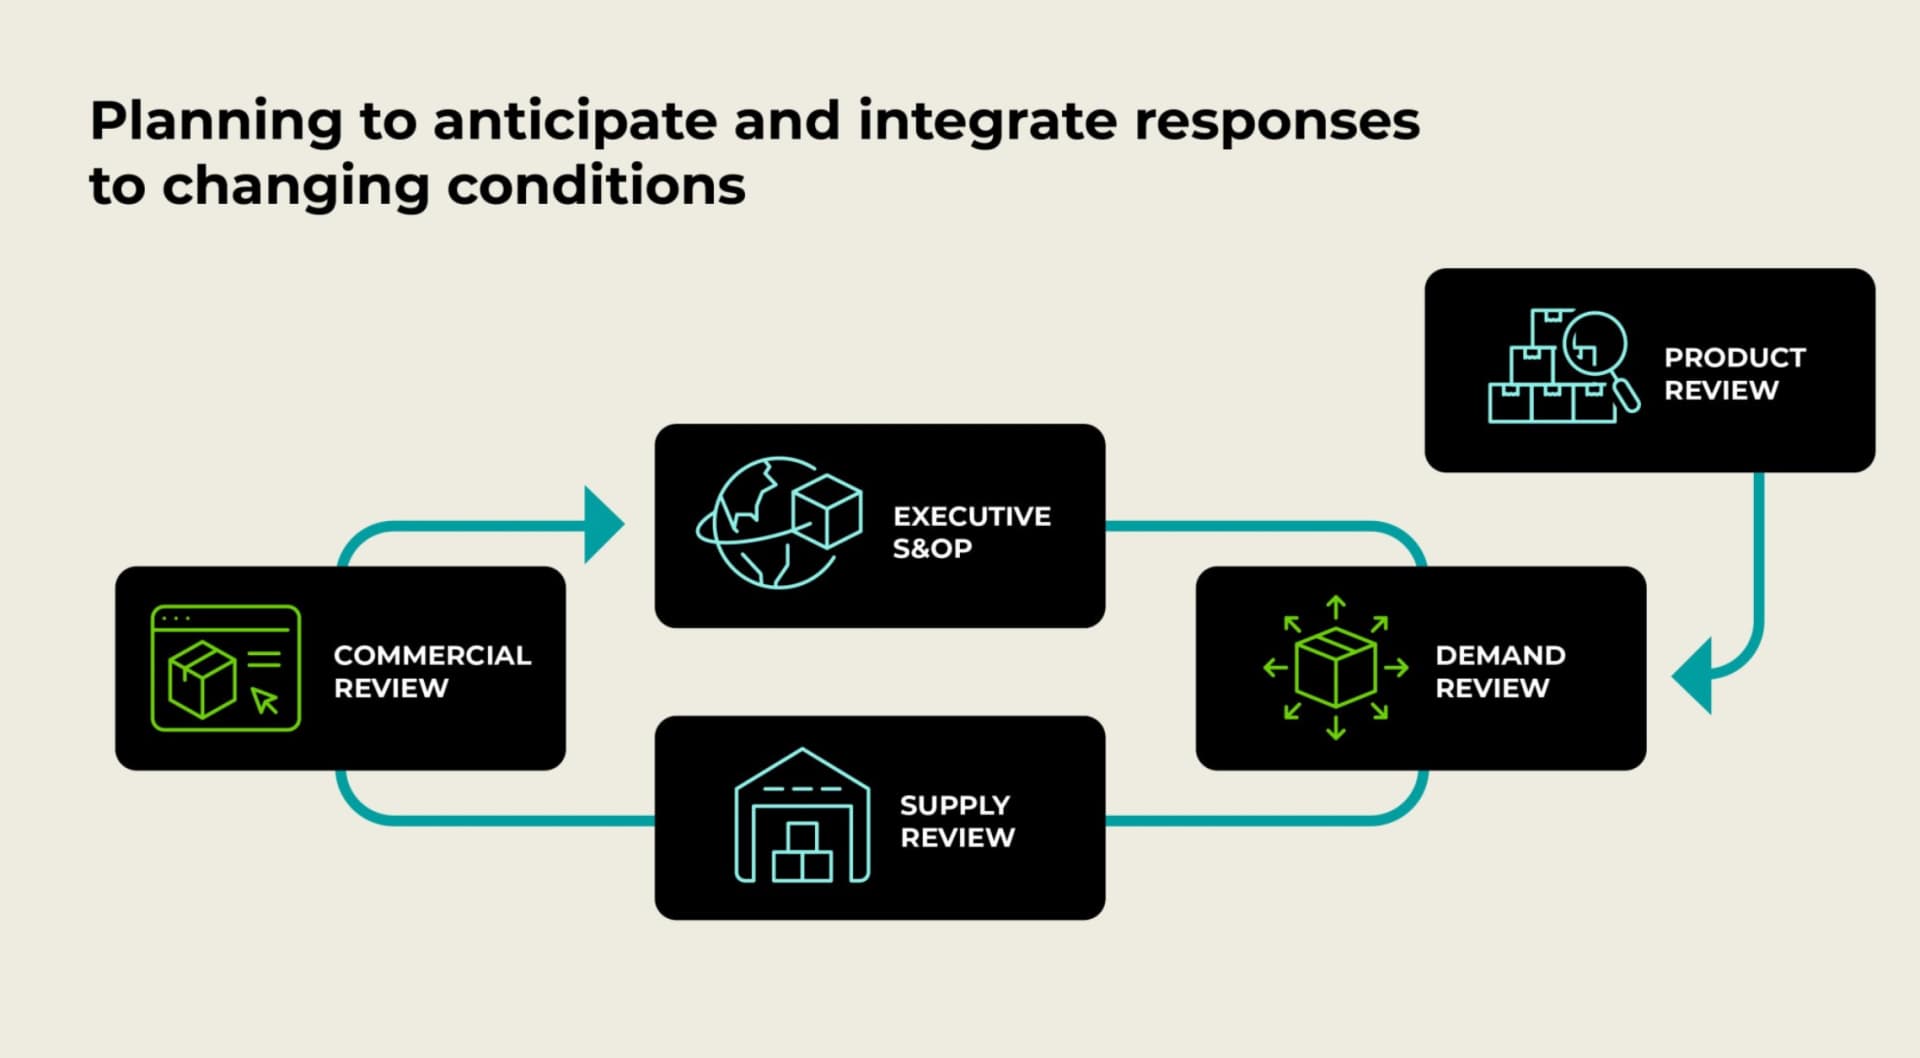
01.Product Review
Review product lifecycle, new product introductions, phase-outs, and portfolio rationalisation. This sets the baseline for what you’re selling.
02.Demand Review
Set and review sales targets, assess the impact of discounts and promotional activities, and build an unconstrained demand forecast.
03.Supply Review
Match supply capacity to demand. Identify constraints in production, procurement, and logistics. Analyse slow-moving stock and inventory health.
04.Pre-S&OP / Reconciliation
Bring demand and supply together. Identify gaps, trade-offs, and scenarios. Prepare recommendations for the executive meeting.
05.Executive S&OP
Senior management owns this meeting. Resolve escalations, review scenarios, adjust strategy, check the budget, and approve the one plan.
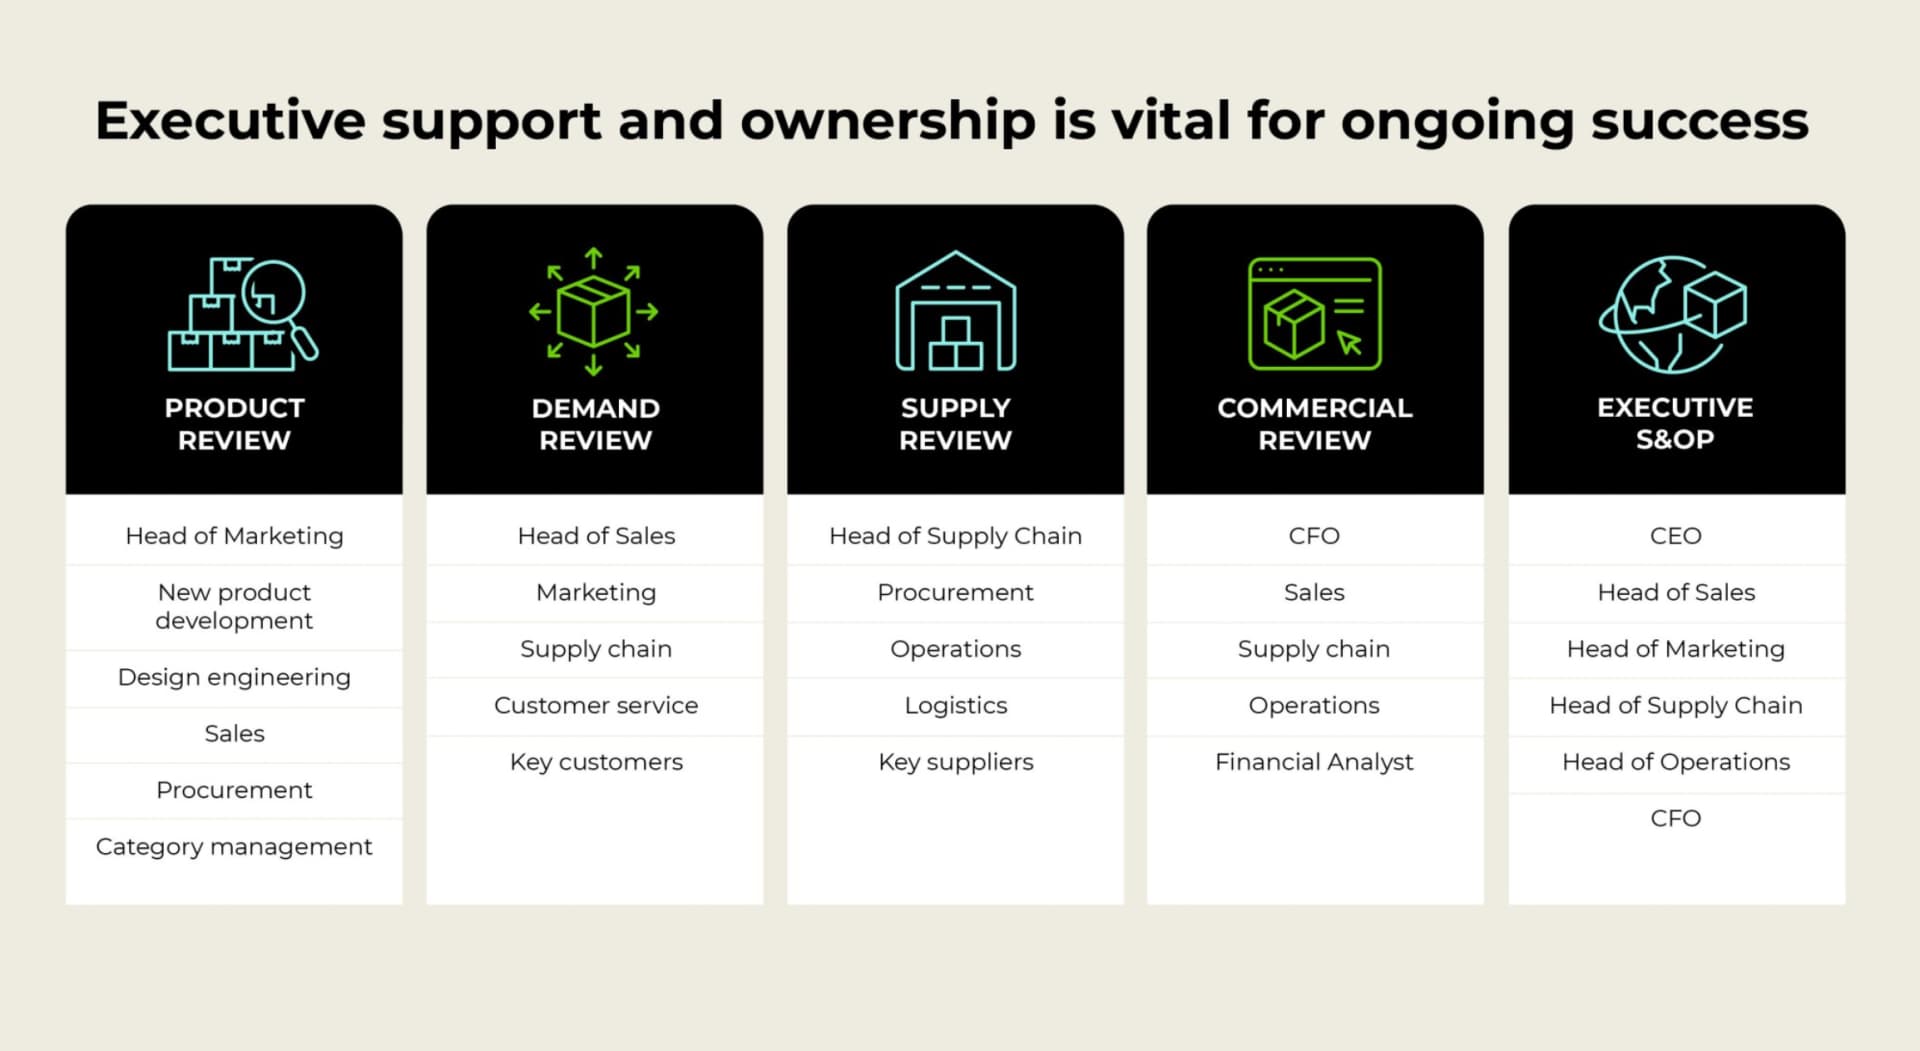
Key challenge
This can be tricky because you’ve got heads of sales, finance, marketing, operations, supply chain, and more. They’re all good at their own functions, but you’re asking them to collaborate cross-functionally and get on board with the same decision. Senior management needs to own and sponsor S&OP, not only to get engagement and buy-in but also to ensure decisions are made.
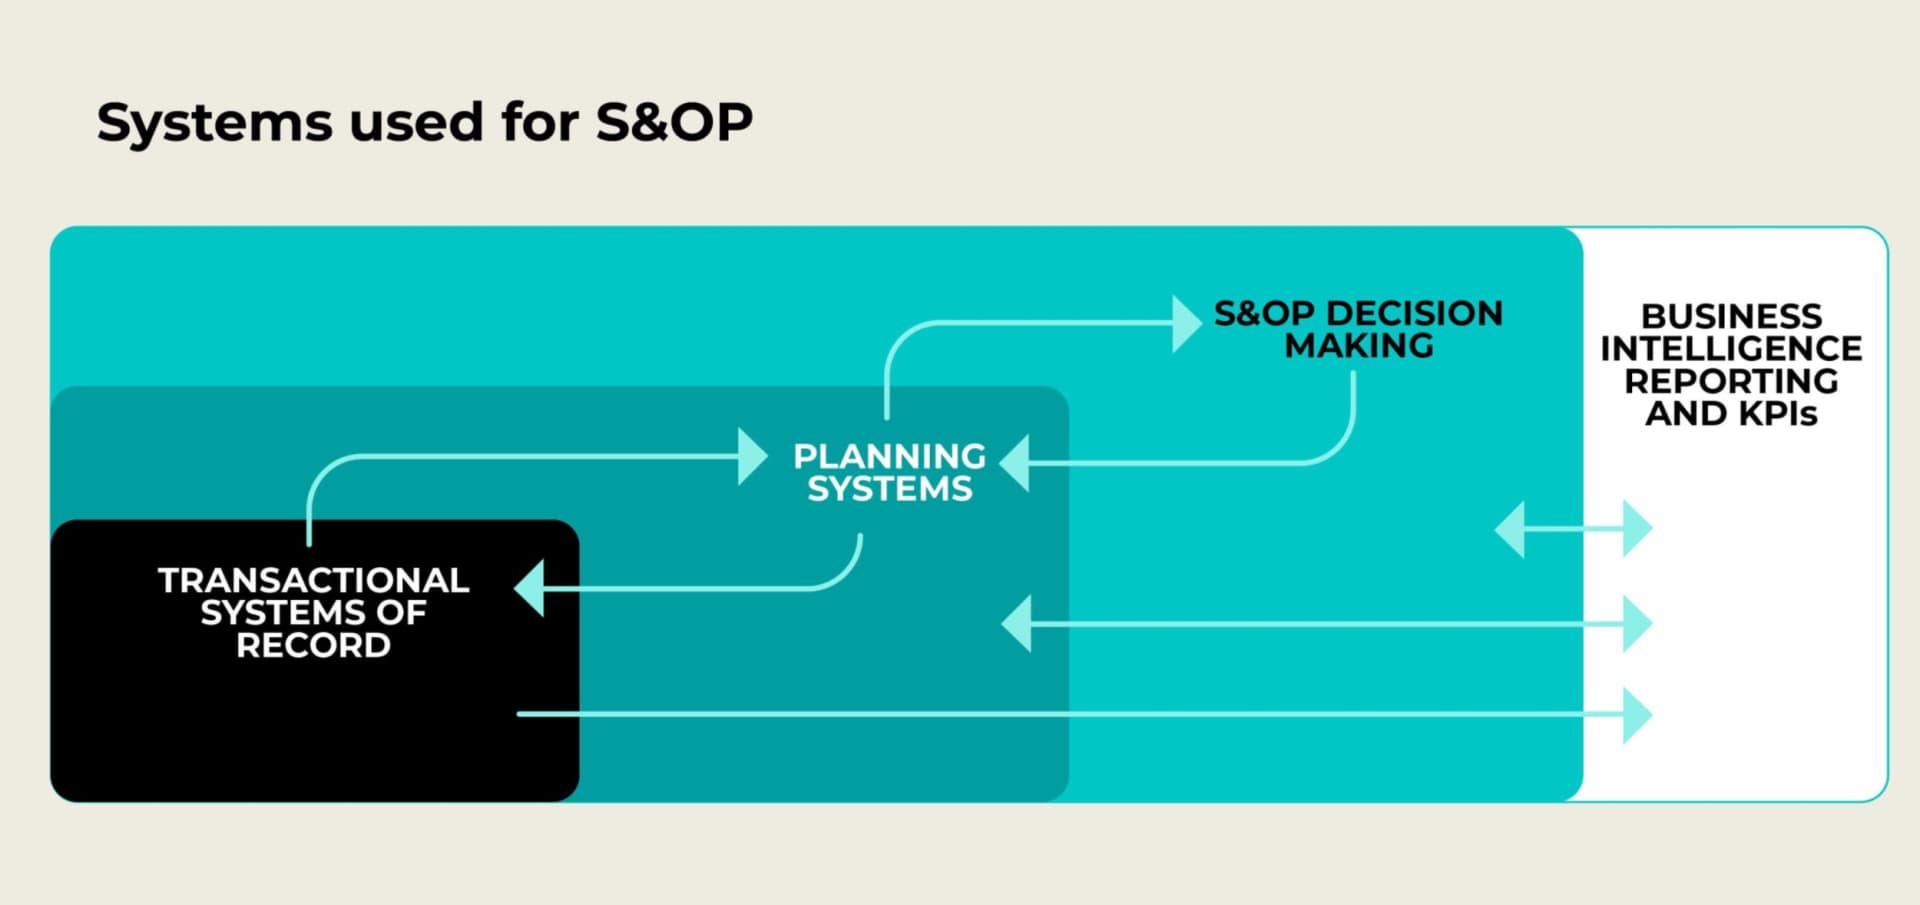
Use Your S&OP Data to Drive Decisions
Data provides fact-based foundations for the insights needed in S&OP decision-making. S&OP sets working capital commitments, labour costs, production output, spend on materials, and more. These decisions are risky if they’re made on just opinions, without sound data.
At the executive S&OP meeting, use data to:
Case Study: NZ Food & Beverage Company
Noël Thomson worked with a New Zealand food and beverage company that created new KPIs and a deck of insights to take to its board, whose members are highly active in decision-making. The company’s management meet regularly and board meetings take place every second month. There is now a suite of insights to help management run the company and make decisions.
An advanced Excel tool was built for under $20,000 and provides the platform and systems for planning and decision-making at S&OP meetings.
Significant Growth
Exporting a container every week or two to Australia — up from once a month
60% Capacity Increase
Moving to 24-hour, 4-day-a-week operation without investing in more equipment
They identified they had an operations constraint and are now looking at a 60% capacity increase without investing in more equipment — simply by optimising how they use existing resources.
How Much Do I Need to Invest in S&OP Systems?
Invest in what you can afford and what ensures ROI. Build systems that fit your enterprise architecture and that work for you.
There are some really sophisticated tier 1 S&OP systems like SAP, e2open, and D365. However, they can be very expensive.
Up to $50M annual revenue
Excel will probably be fine, provided you build principles of good supply chain planning into those algorithms.
$10–20M annual turnover
Many businesses have good transactional record systems. Extract data points into a plan using Excel or a SaaS product such as NetSuite or StockTrim.
Larger / more complex businesses
Consider tier 1 platforms like SAP, e2open, or D365 for integrated planning and decision-making.
How Can I Tell If Our S&OP Planning Is Working?
What you measure depends on your business priorities. When you measure things, you want to be able to roll up to a level of categories, families, and channels, and drill down so you can understand the insight behind what’s being asked.
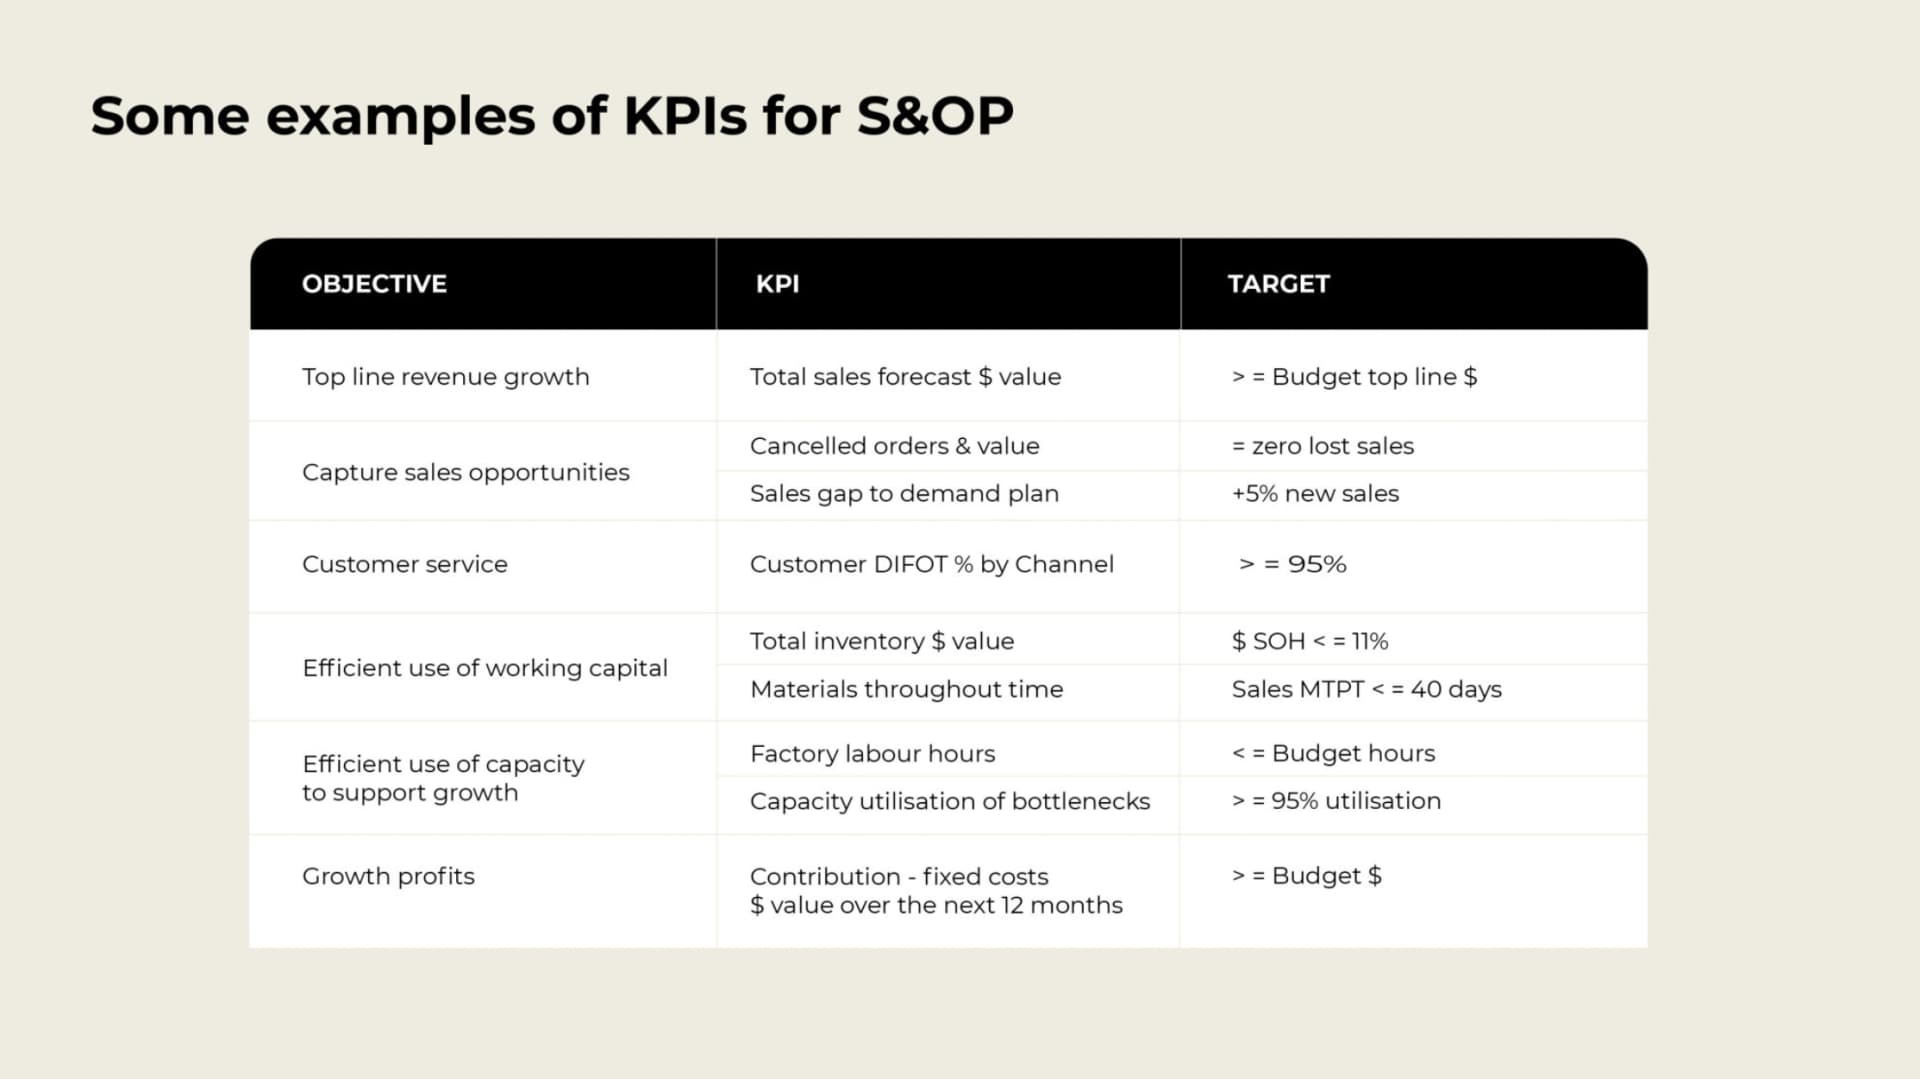
Example KPIs
Key insight
Look at your trends. Take a helicopter view and see how you’re progressing over time. S&OP is the ideal continuous improvement cycle. Teams meet regularly, review performance, and make action plans to drive towards the common goal.
Where to Start
You don’t need to implement everything at once. Start with the basics: gather your cross-functional team, establish a regular meeting cadence, and build visibility into your demand and supply. Even simple tools built in Excel can unlock significant improvements — as both case studies demonstrate.
Learn more about S&OP